
Know where every
kWh goes.
A Trubros EMS reads all your energy meters — grid, DG sets, solar and every feeder — stores the data on a database server on-premise or in the cloud, and emails a daily Excel report to your team before the morning meeting.
Meters
Multifunction energy meters on incomers, DG sets, solar and feeders, linked on RS-485 Modbus.
EMS panel
A Trubros data-logging panel with PLC/gateway polls every meter every few minutes.
Database server
Readings stored in a SQL database on your own server or in the cloud, with full history.
Daily report
An Excel report generated automatically and emailed to the people who need it.
Browser access
Dashboards, trends and custom date-range reports from any browser, on any device.
In your inbox every morning
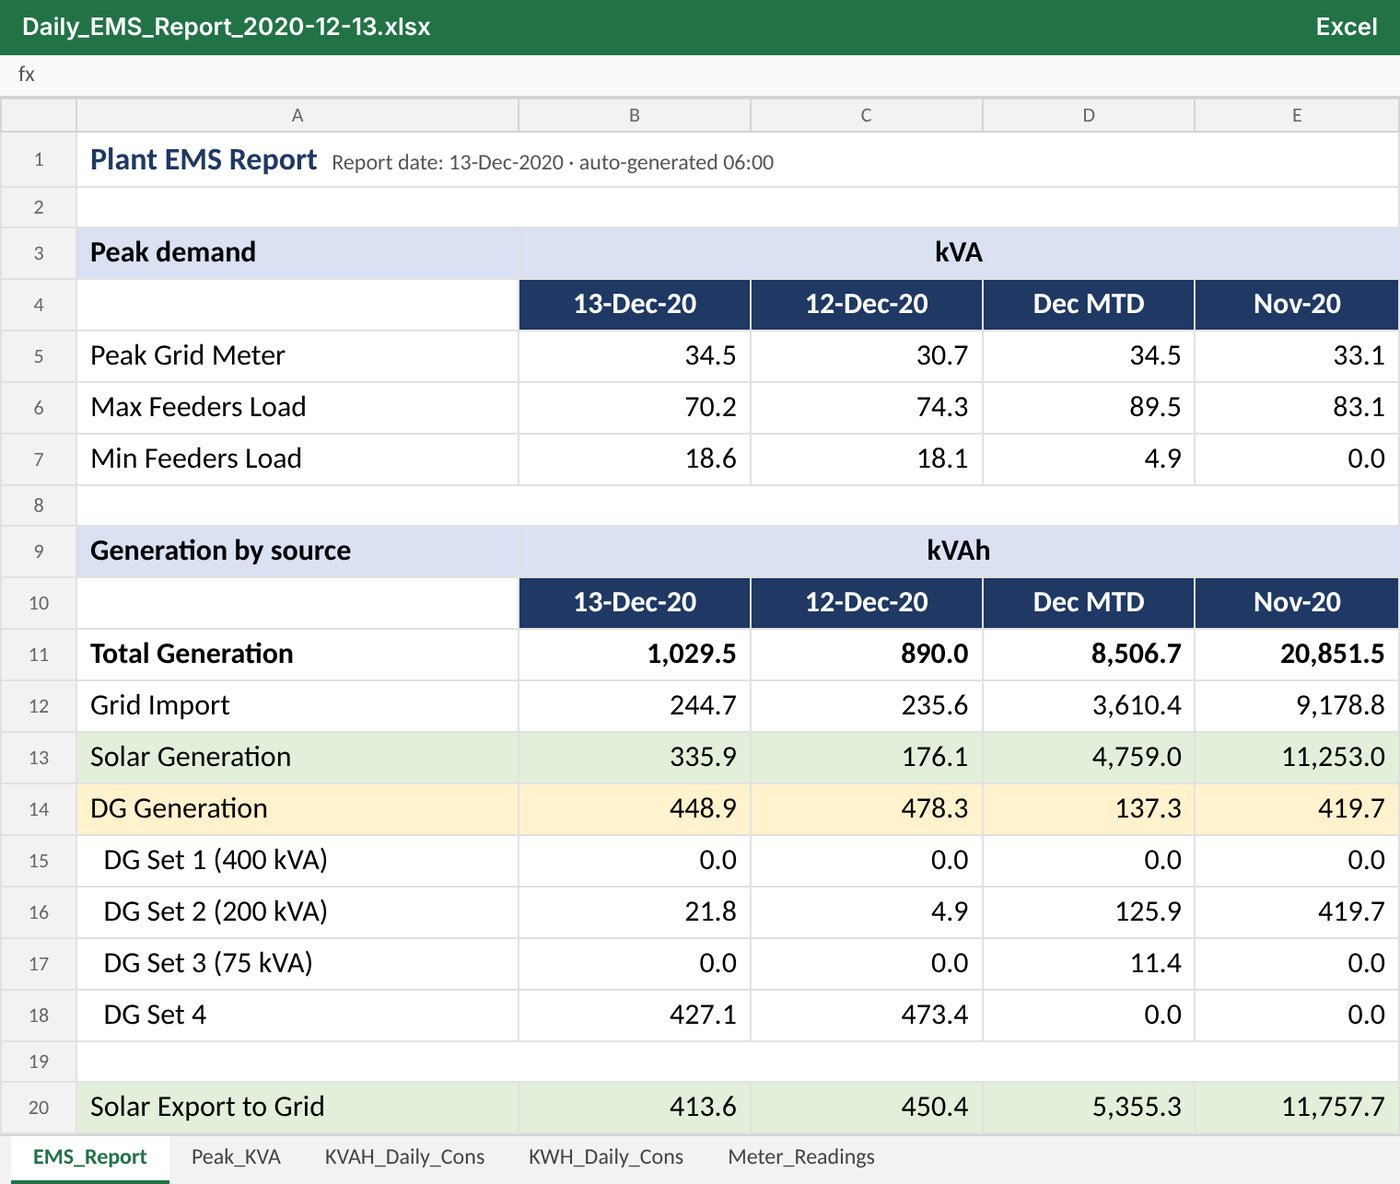
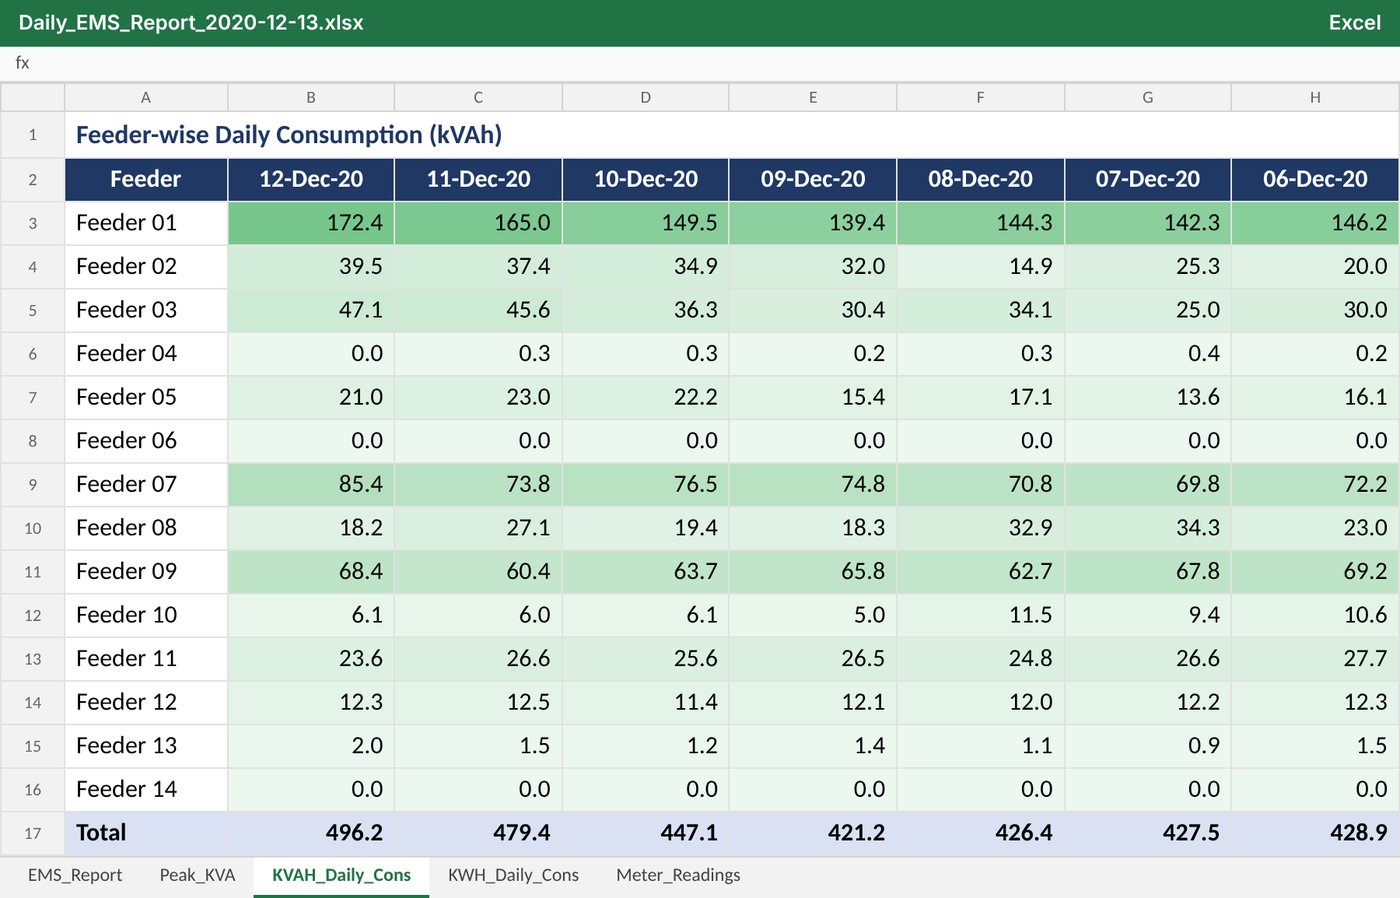
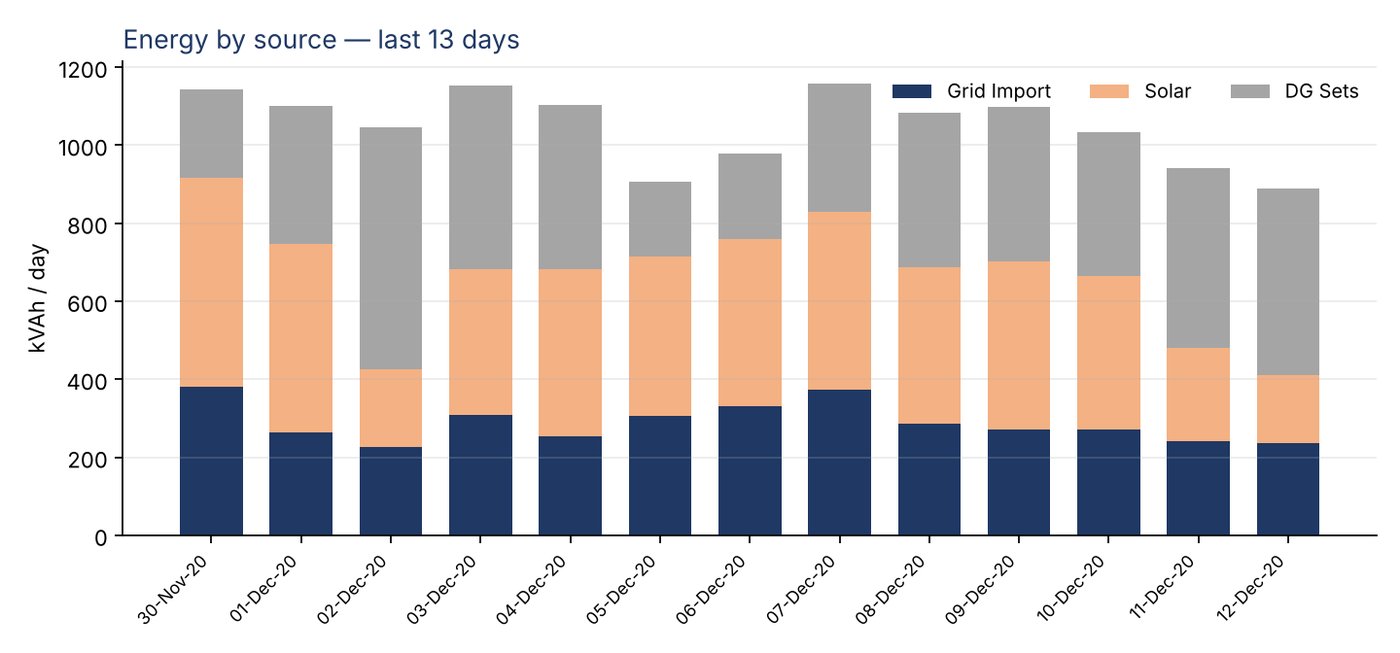
Screens from a real EMS report emailed daily at 06:00 for a multi-source site (grid, solar and four DG sets). Customer and feeder names have been replaced.
Every parameter that costs you money
Peak demand (kVA)
Daily and monthly peak kVA with the exact time it happened — the key to controlling maximum-demand charges.
kWh & kVAh by feeder
Consumption per feeder, building or machine, per shift and per day — with min/max load and over-consumption flags.
Solar & DG accounting
Solar generation, export to grid and self-consumption; DG-set energy and running hours for fuel reconciliation.
Power quality
Voltage, current per phase, power factor and imbalance — catch PF penalties and failing equipment early.
Scheduled reports
Daily, weekly and monthly Excel reports by email; formats designed with you to match your MIS.
Browser dashboards
Live values, trends and any-date-range reports from the browser, for management and maintenance teams.
On-premise or cloud
- On-premise — database and report service on your own PC or server; data never leaves the plant.
- Cloud — the EMS panel sends data over 4G or your internet line to a Trubros-hosted or your own cloud server.
- Existing meters — most Modbus-capable meters you already have can be connected, keeping cost down.
- Panels built in-house — EMS panels designed in PanelCAD and wired in our Gurugram works.
What sites use the data for
- Shifting loads to stay under the contract demand
- Finding feeders running at night or on holidays
- Reconciling DG fuel against kWh generated
- Verifying solar output and export credits
- Allocating energy cost to departments
Want this report for your plant?
Share your single-line diagram and meter list — we'll propose the EMS panel, server option and report format.